Understanding the `top` Command: Monitor System Processes
Master the `top` command in Linux to monitor system processes and resource consumption. This guide explores its real-time dynamic interface, showing how to manage your system's CPU and memory usage efficiently. Become proficient in navigating processes and enhancing performance effortlessly.

Navigating system processes can be tricky, especially if you're new to Linux. There's a handy tool to simplify this task: the top command. This guide provides a concise tutorial on using the top command for monitoring system performance, managing Linux processes, and understanding resource consumption. Let's dive into best practices for utilizing this powerful command.
What is the top Command?
The top command in Linux lets you monitor system processes and resources in real-time. It provides a dynamic view of the system's running tasks and allows you to see which processes are consuming the most resources.
Key Features of the top Command:
- Displays real-time CPU and memory usage information.
- Sorts processes and provides detailed process statistics.
- Offers an interactive interface for process management.
Basic Usage of the top Command
To begin using the top command, open your terminal and type:
top
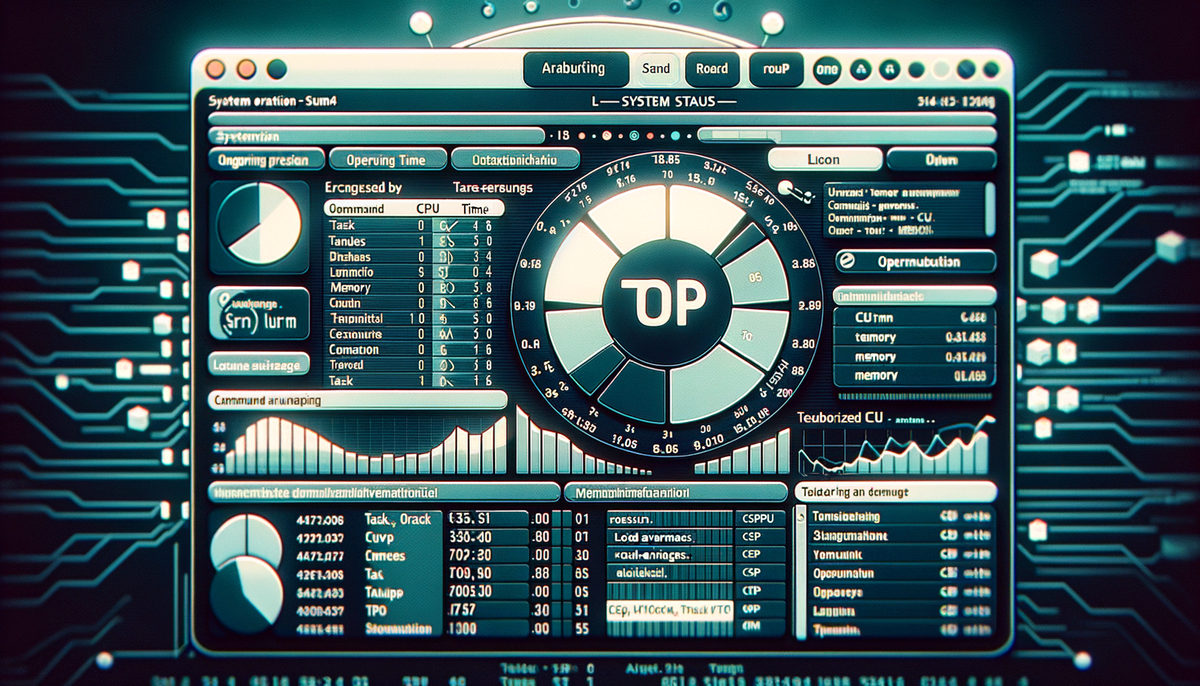
Once executed, you'll see a live feed of running processes and resource consumption, like this:
top - 15:22:25 up  2:08,  1 user,  load average: 0.00, 0.01, 0.05
Tasks: 102 total,   1 running, 101 sleeping,   0 stopped,   0 zombie
%Cpu(s):  0.3 us,  0.2 sy,  0.0 ni, 99.4 id,  0.0 wa,  0.0 hi,  0.1 si,  0.0 st
MiB Mem :   7986.4 total,   2305.0 free,   1189.9 used,   4491.5 buff/cache
MiB Swap:   2048.0 total,   2048.0 free,      0.0 used.   6275.4 avail Mem

  PID USER      PR  NI    VIRT    RES    SHR S  %CPU  %MEM     TIME+ COMMAND
 1143 root      20   0  169172   6596   3540 S   0.7   0.1   0:01.17 Xorg
Understanding the top Output
Here's a breakdown of the essential components you see in the top command output:
1. System Uptime and Load Average
- Uptime shows how long the system has been active.
- Load Average indicates the system's load over the last 1, 5, and 15 minutes.
2. Tasks and CPU Usage
- Tasks track the total number of processes and categorize them by status (running, sleeping, stopped, zombie).
- CPU Usage breaks down CPU usage into categories such as user processes and system tasks.
3. Memory Info
- Memory displays total memory, free memory, and memory used by active and cache processes.
- Swap shows total swap memory, free swap memory, and swap used.
Navigating within the top Command
The top command is interactive, meaning you can use keyboard commands to manipulate what you see. Here's how you control the interface:
- Shift + P: Sort processes by CPU usage.
- Shift + M: Sort processes by memory usage.
- Shift + T: Sort processes by running time.
- k: Kill a process by PID (enter PID after pressing this).
- q: Quit the
topcommand.
Advanced top Command Options
You can modify the top command's behavior using various options. Here are a few useful ones:
1. Running top in Batch Mode
To save the top command output into a file for later analysis, use:
top -b -n 1 > top_output.txt
-b: Batch mode operation.-n 1: Number of updates beforetopexits.
2. Customizing Columns
Press f in top to open the field manager. Use arrow keys to navigate and the space bar to toggle column visibility.
3. Setting Refresh Interval
Change the default 3-second update interval with:
top -d 2
Common Questions and Scenarios
Using top, you can identify system performance issues:
- If your system is slow,
tophelps find processes using excess CPU or memory. - To reduce memory usage, sort the list by memory to identify memory-heavy processes for potential termination.
- In case of a rogue process using all CPU resources,
tophelps find and stop it to prevent system crashes.
Best Practices for Using the top Command
- Regularly monitor your system with
topto prevent overloading. - Observe load averages to understand system performance over time.
- Use sorting features to quickly identify resource-heavy processes.
- Focus on processes affecting user experience or critical system performance.
Conclusion
The top command is an essential tool for Linux users, providing a detailed view of system activity. By navigating its interactive interface and using its options, you can effectively manage your system's processes and resources. The more you use the top command, the more proficient you'll become in interpreting its data, turning you into a pro at managing Linux resources. With this guide, you now have a solid understanding of the top command's capabilities—start optimizing your Linux system today!


